Data analysis of poverty rate in the US between years 2011 - 2021. Data visualization includes an animated dinamic plot that shows poverty rate in different states of the US within 10 years.
See the code here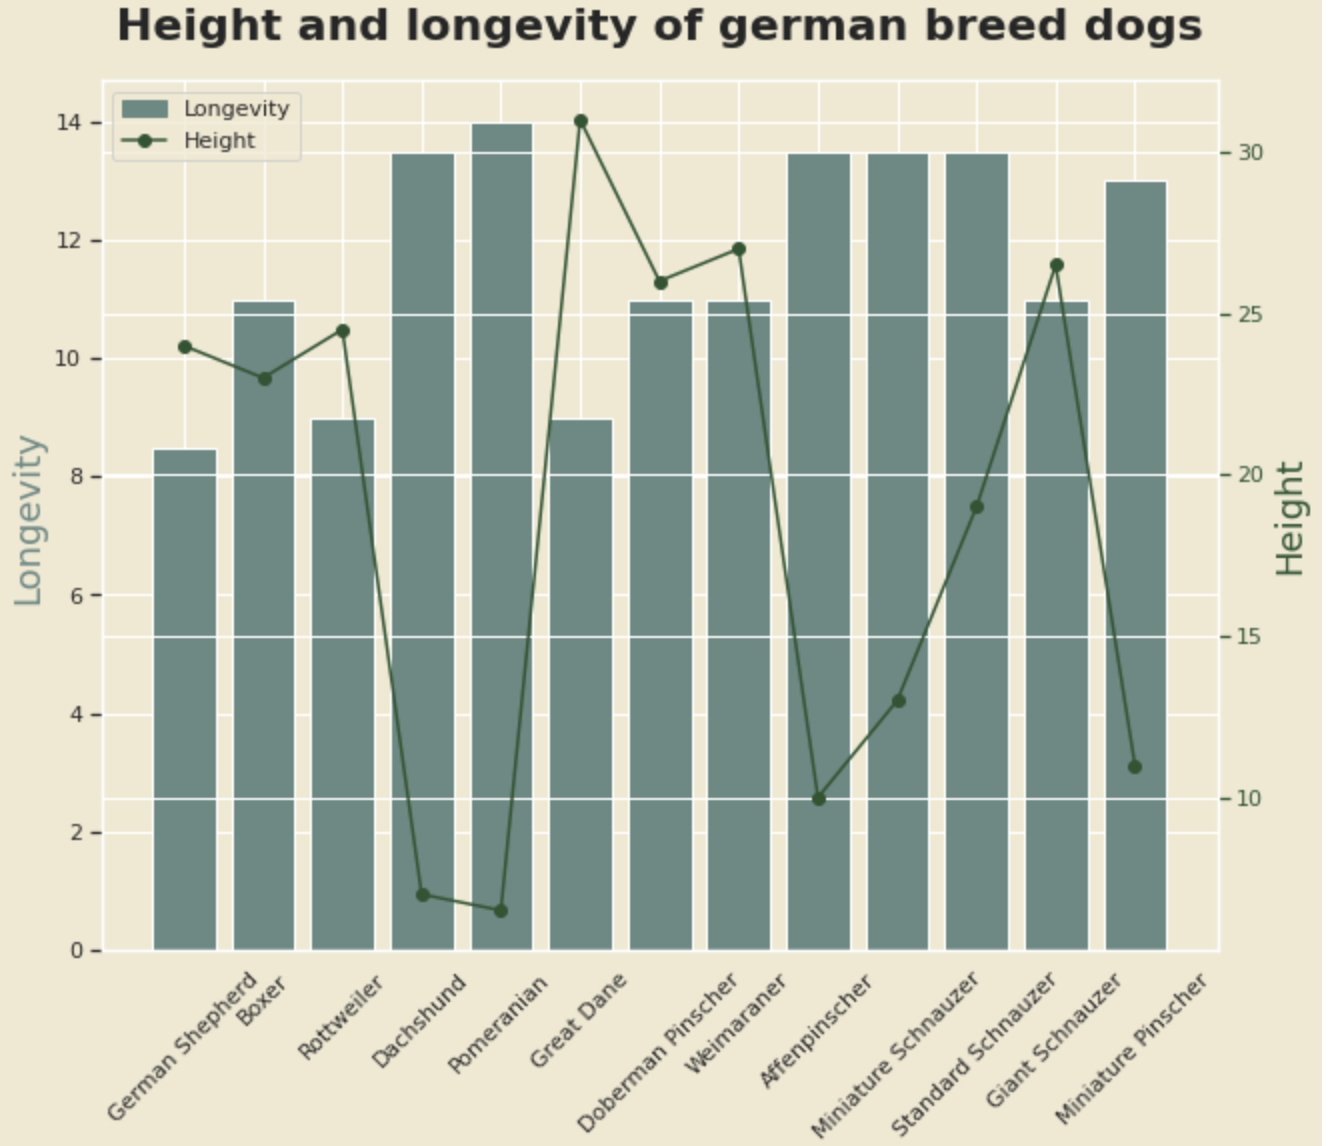
Dogs breeds linear regression analysis with Python. The analysis inlcudes data cleaning, data transformation and data analysis with Python.
See the code here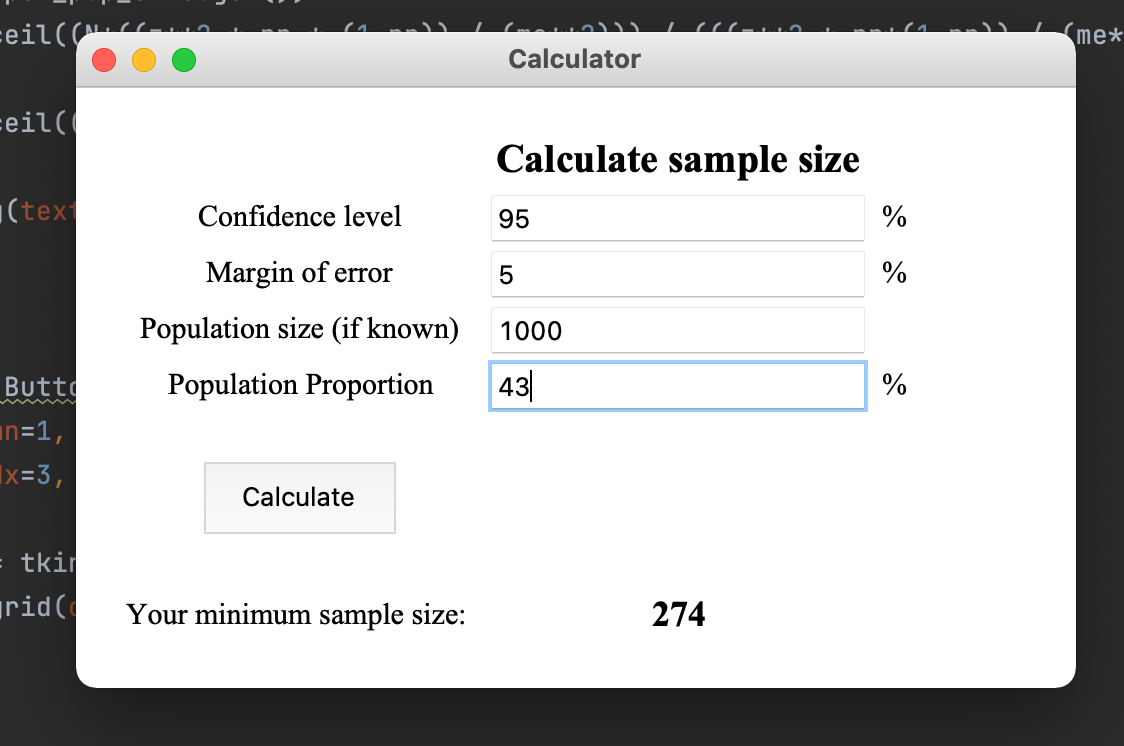
Sample size calculator is a program that I wrote on Python,
that allows a user to calculate the minimum needed sample size.
The parameters are: confidence level, MOE, population proportion and population size.
The latter is optional and if not known,
the program will use a different formula allowing to get the result.
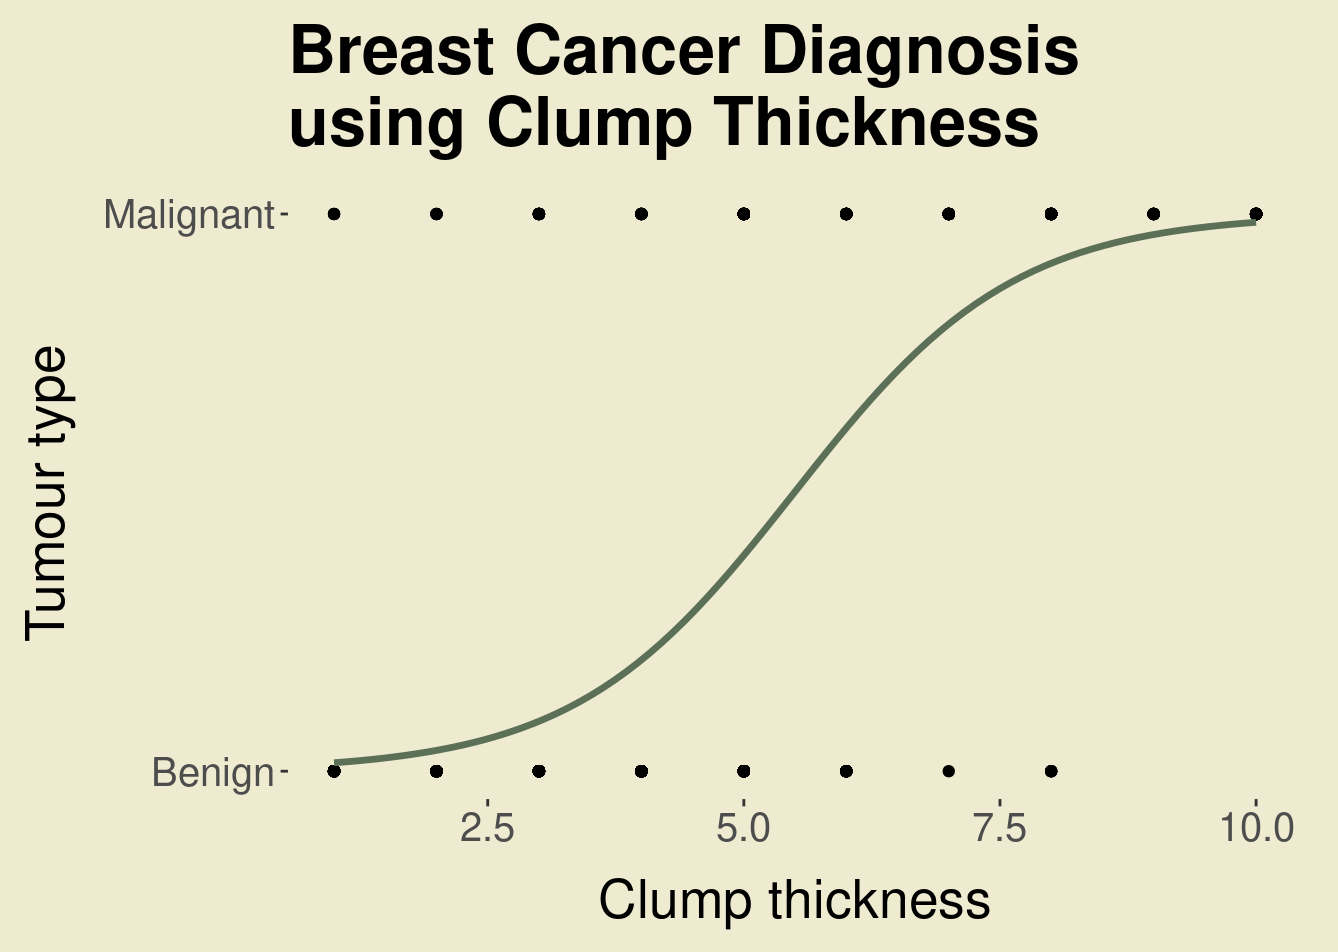
Logistic regression analysis in R is a binomial analysis that allows to classify cancer as malignant or benign based on the given variables.
See the code here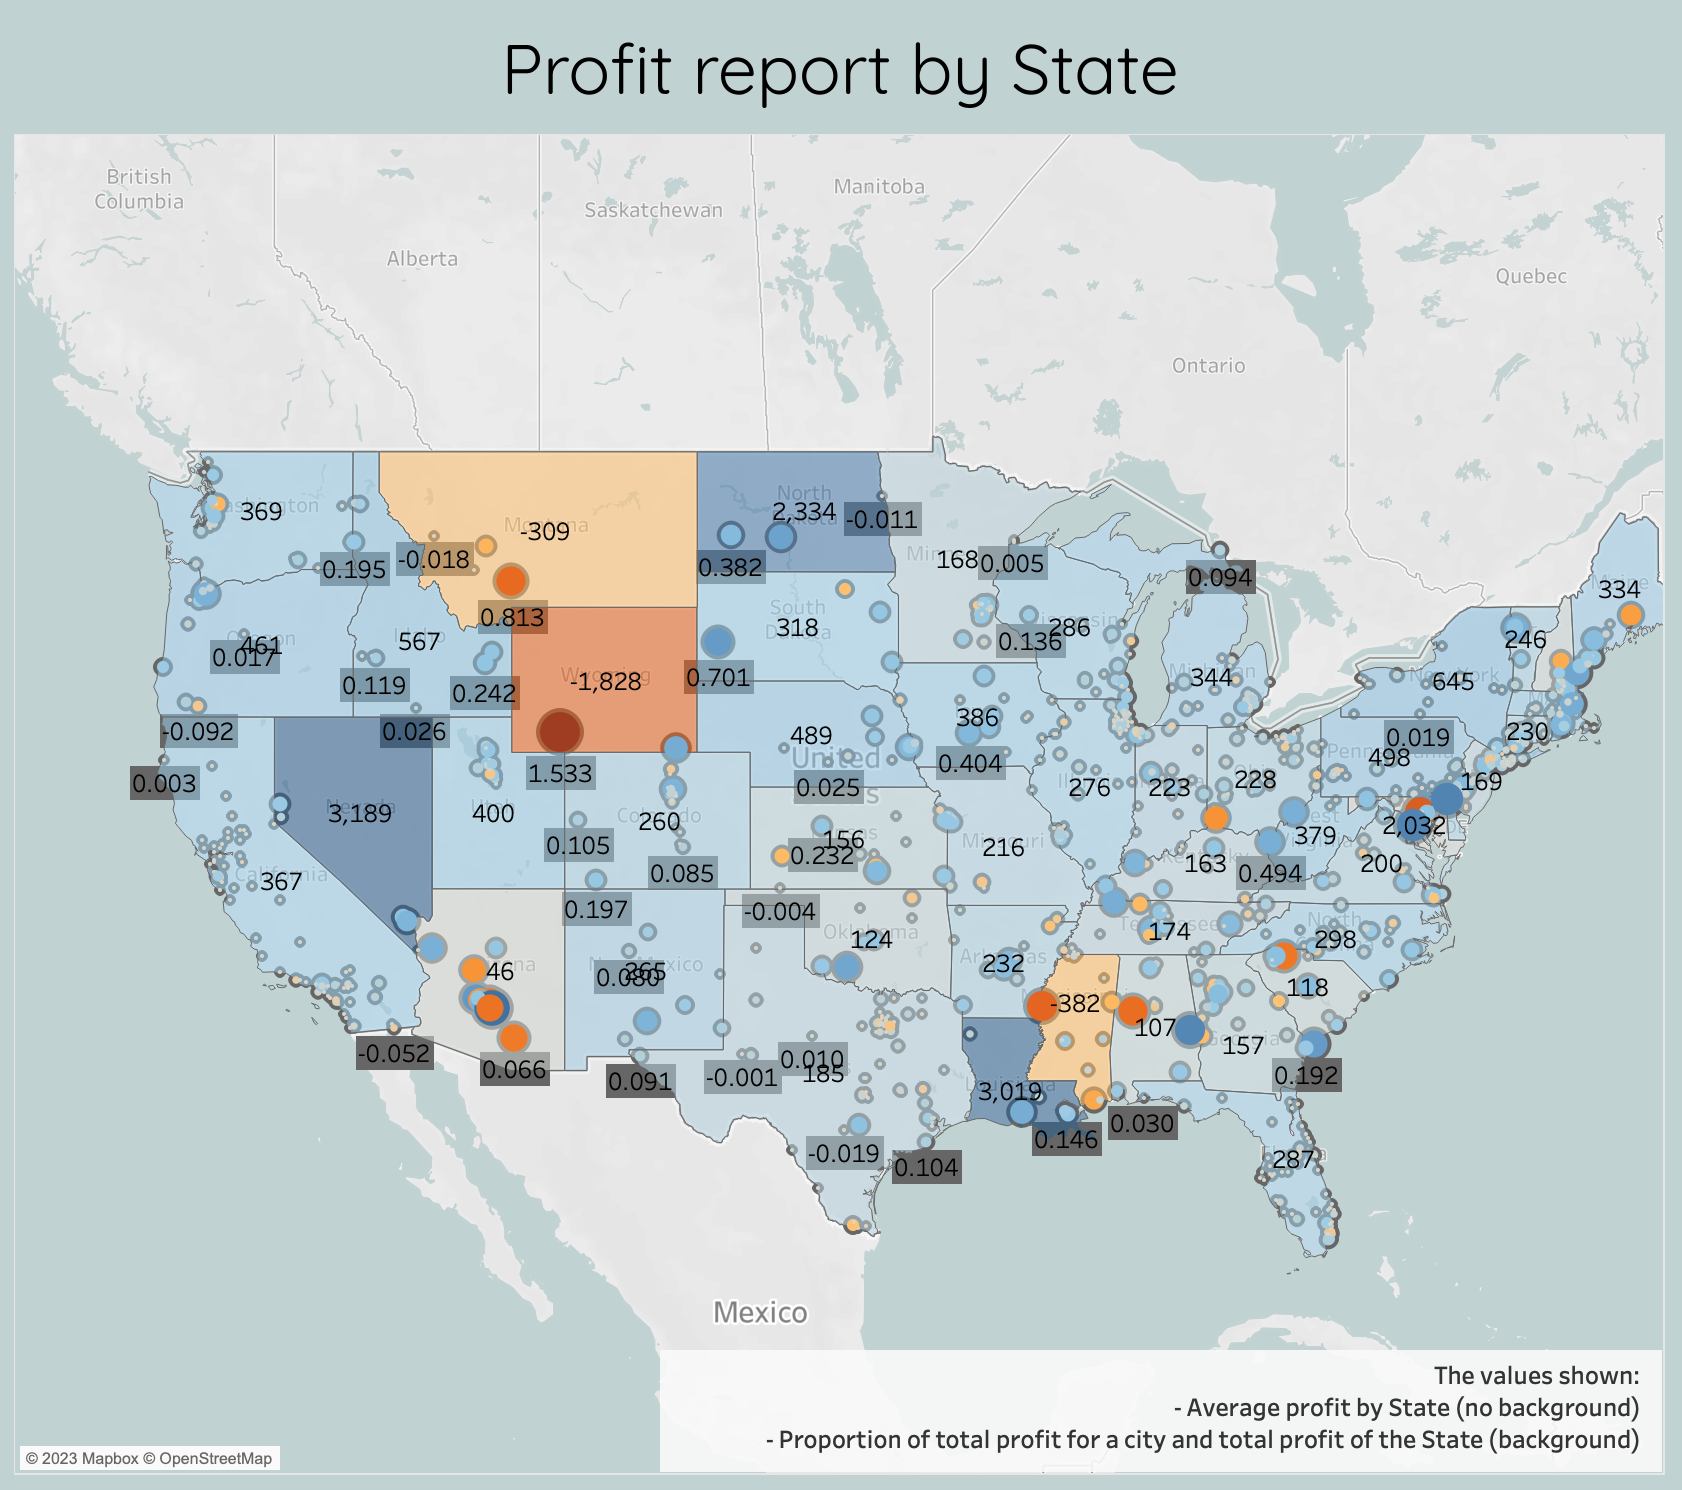
A Tableau dashboard that shows average profit by State and proportion of total profit for a city and total profit of the State
See dashboard here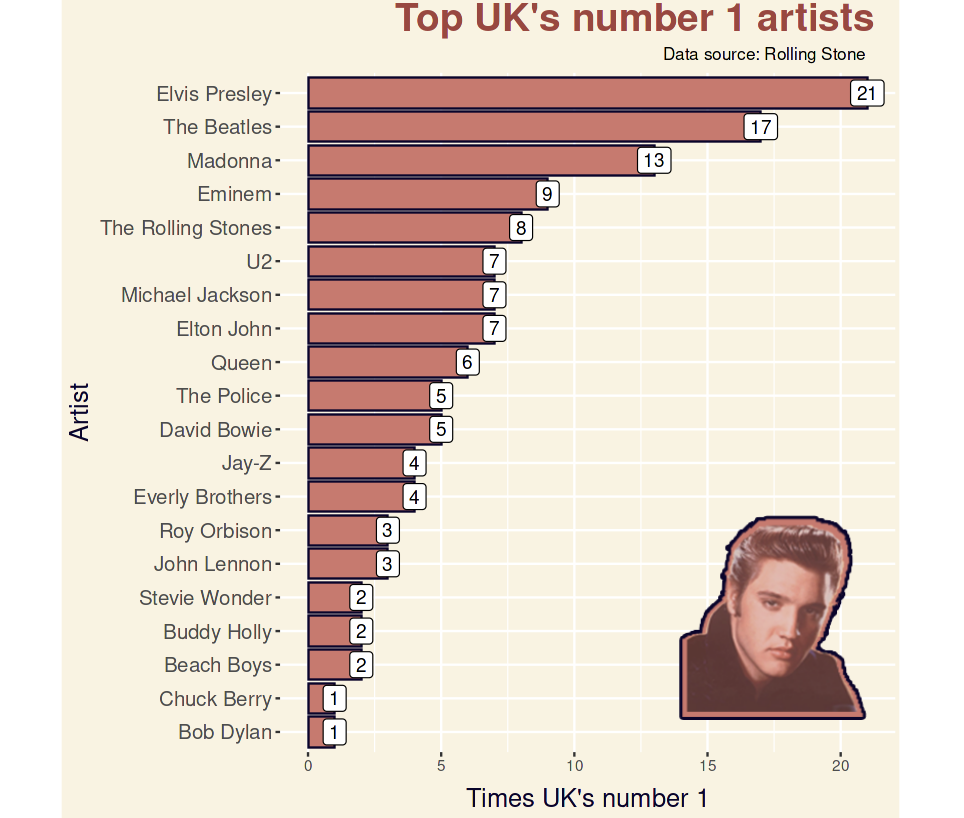
The analysis includes data scraping from Wikipedia and Twitter, data cleaning, data analysis, sentiment analysis.
See the code here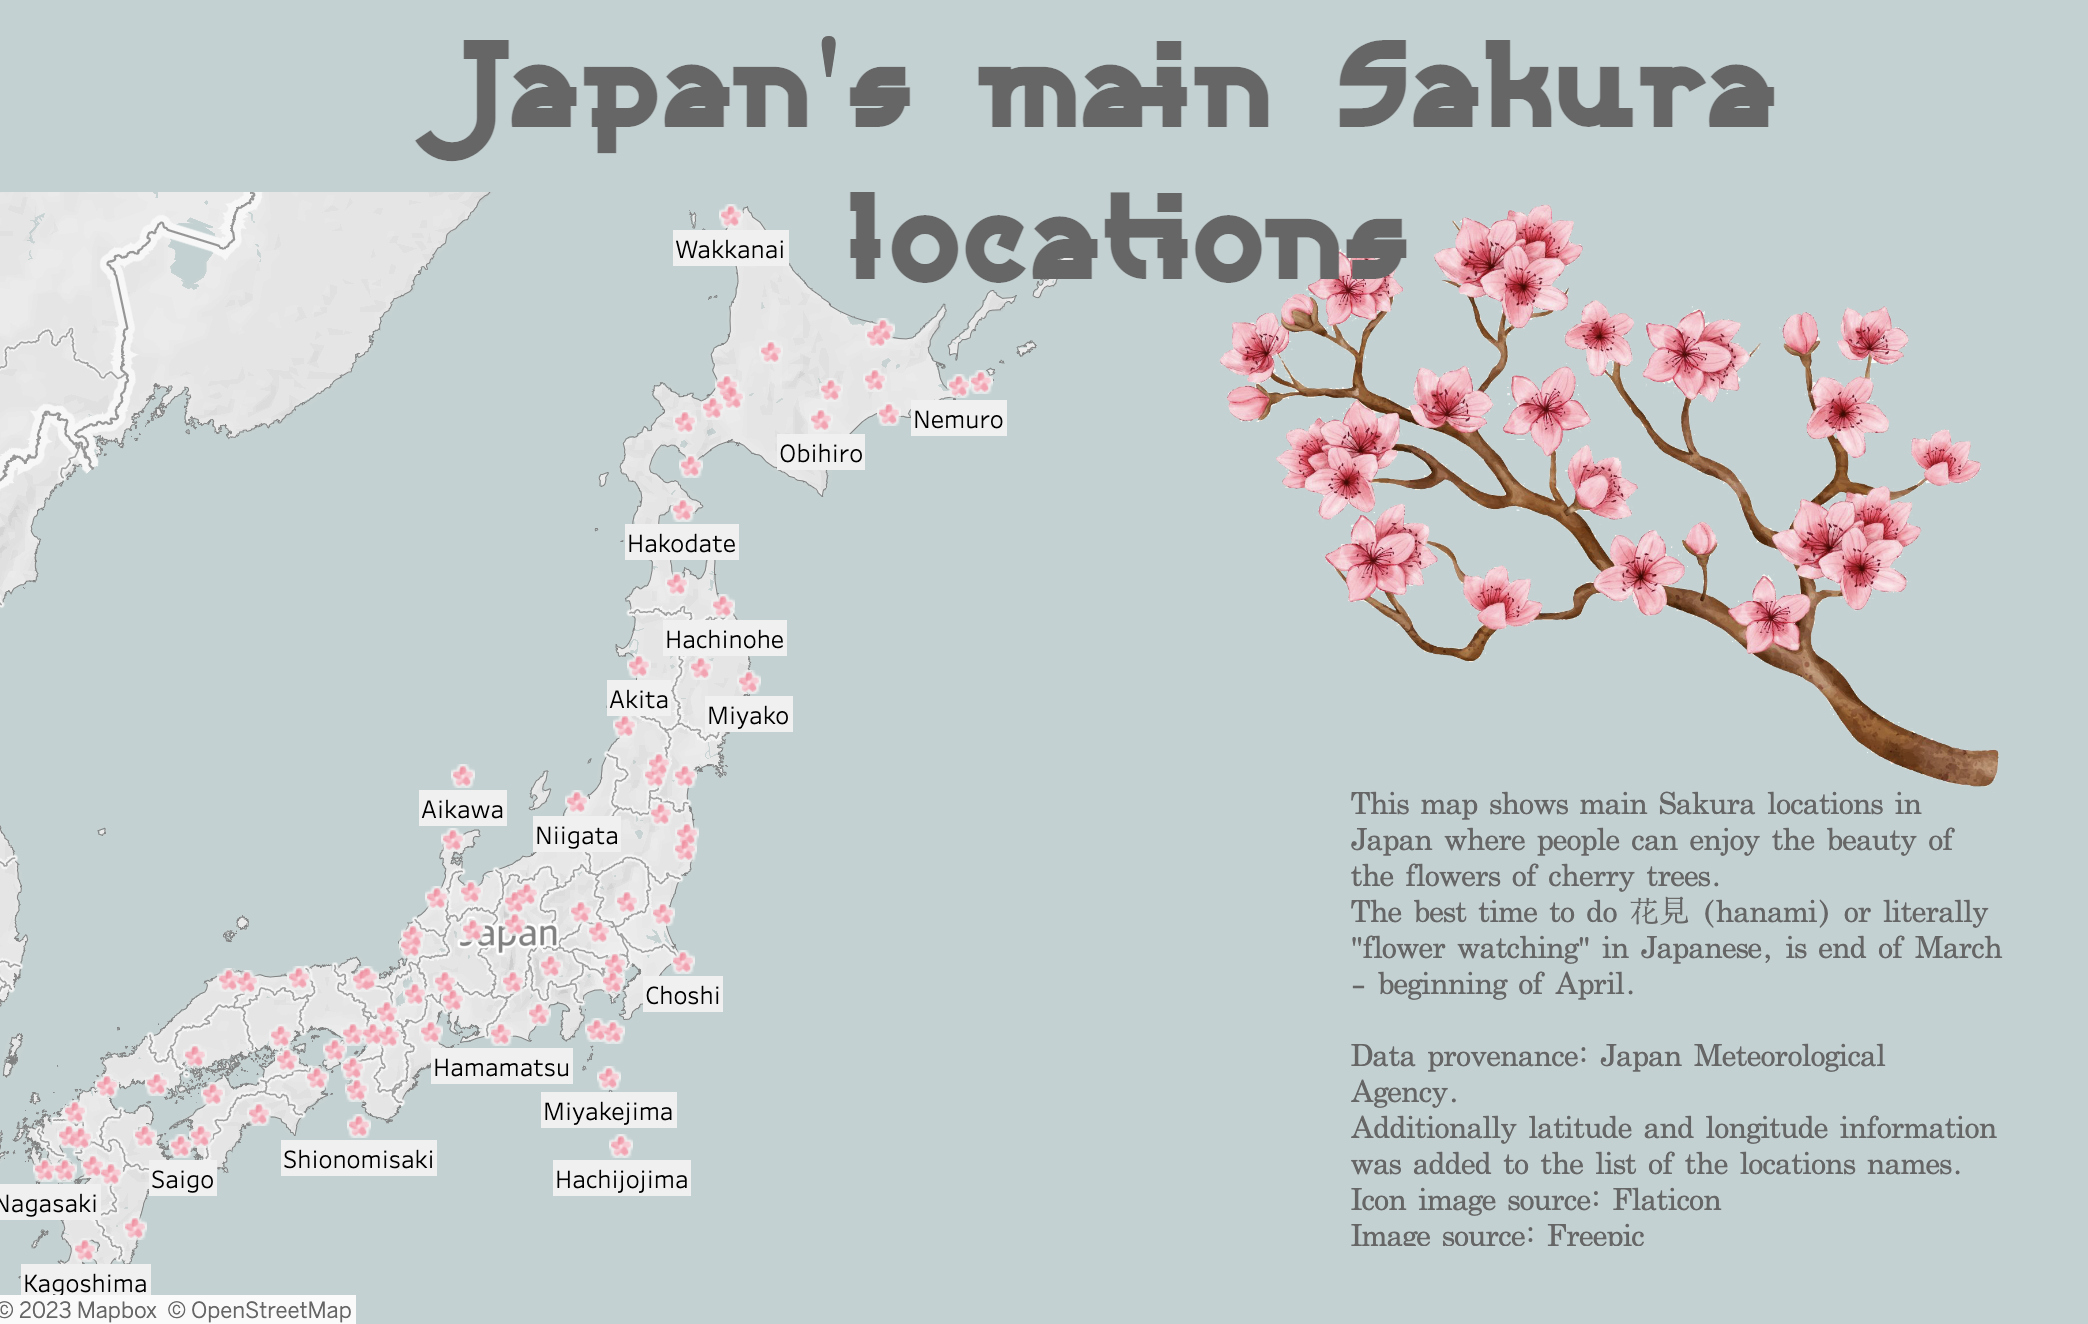
Tableau visualization of main locations of sakura in Japan. The locations are mapped with a customized icon.
See dashboard here